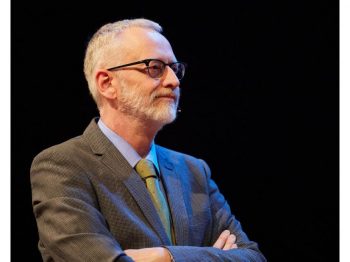
When Daniel Hiebert first arrived in Vancouver in 1986 to take up a teaching position in the UBC geography department, the city was embarking on a new era. It was the year of Expo — a six-month world fair that welcomed millions of visitors to the city and launched Vancouver as a global destination. Hiebert’s timing meant he would have a front-row seat to Vancouver’s growing diversity.


“Within five to seven years, I noticed that my classes were changing,” he says. More students from Hong Kong, Taiwan, Punjab, and other parts of Asia began enrolling, reflecting new waves of immigration from the Pacific Rim. “I started wanting to be able to tell my students about themselves and how this change was happening.”
Hiebert’s interest in diversity and immigration started early. Raised in a Mennonite community in Manitoba, he grew curious about how people imagine themselves as different from others and how that difference plays out in society. “It was a group that closed itself off as much as they could from worldly influences and saw itself as separate from Canadian society.” He completed a PhD on the early Jewish community in Canada, a group that, like his own ancestors, had fled from Russia under the barrel of a gun.
For the past three decades, Hiebert has worked on immigrant integration, immigration policy, and national security. He frequently advises the government and NGOs on such issues and served as co-chair of the City of Vancouver Mayor’s Working Group on Immigration. One of his ongoing goals has been to present accurate and digestible data about immigration to help the public and policy-makers better understand emerging trends.
His latest project is Superdiversity, an interactive website that pools massive amounts of data on immigration and presents it in new and powerfully engaging ways. Created in collaboration with colleagues in New Zealand and Australia, it highlights data from Vancouver, Sydney and Auckland — three cities with similar immigration histories and populations that are around 40 percent foreign-born. The goal is to help users visualize how these cities are diversifying society on multiple levels, not just in terms of ethnicity, but across religion, education, income, legal status, and economic mobility.
We asked him to share four takeaways from the website about Vancouver’s superdiversity story.
#1: Although immigration to Canada has remained steady over the past 30 years (the country has admitted roughly 250,000 immigrants per year since the 1980s), the number of source countries has exploded.
In 2017, Canada welcomed immigrants from almost 200 countries — nearly “every corner of the world,” says Hiebert. Compared to previous eras, we’re now seeing more people in smaller numbers coming from more places. Not only has there been an increase in origin countries, but the combinations of ethnicity, language, education, age, gender, and legal status have multiplied. “This is part of the superdiversity story, helping us get past the idea that a city like Vancouver is only about immigration from, say, India, China, and the Philippines,” says Hiebert. “Yes, each of those countries is highly significant, but immigrants also come from a host of other origins.”
What explains this shift? Hiebert offers a few explanations. Access to education has increased across the globe. This means a much wider pool of people satisfy the requirements of Canada’s immigration points system, which gives bonus points to highly educated and skilled applicants. On the humanitarian side, Canada now admits refugees from anywhere that the UN’s refugee agency deems appropriate, whereas in previous decades, it targeted refugees from specific conflicts – namely those fleeing communist regimes. Finally, Hiebert says there has been a globalization of the desire to immigrate, driven in part by exposure to global culture.

#2: There is so much diversity within ethnic groups that that the concept of an “ethnic community” is meaningless.
When Canada launched its multiculturalism policy in 1971, the prevailing metaphor of Canadian society was the mosaic. Ethnic groups were imagined to be relatively homogenous. So when the government wanted to get a better understanding of its ethnic communities, it pulled together a committee of known leaders to speak on behalf of their respective communities. “The Jewish guy was on that committee to speak about the Jewish perspective,” says Hiebert. “He represented hundreds of thousands of people. Same thing with the Polish guy, the Ukrainian guy, and so on.” For Hiebert, this approach was driven by a now defunct idea that you could pluck someone — usually a man — out of a community and expect them to represent the views of an entire group.
To illustrate the shortcomings of that thinking today, Hiebert points to the example of Eritreans in Metro Vancouver. Although they account for only a few thousand, they identify with 15 different religious orientations and none of these claim more than one fifth of the Eritrean population. Hiebert says that this simple statistic raises all kinds of questions. “If, say, a municipal government wants to consult ‘the Eritrean community’, how would it do that? Even deeper, what does the concept of an ethnic community mean if it is so diverse on such an important aspect of social life as religion?”

#3: There are significant differences in the transfers of human capital vs. financial capital between immigrant groups.
The website shows that some immigrant groups become homeowners at a much faster rate than other immigrants groups or the general population, while others enter the workforce more quickly. For example, between eight and nine of 10 Chinese immigrants purchase homes within five years of arriving, whereas only half gain employment within that time period. Meanwhile, nine of 10 Filipino immigrants have jobs within five years of arriving, but just four in 10 are homeowners. “This speaks about the transfers of human capital vs. financial capital in the immigration experience,” says Hiebert.
The fact that many immigrants arrive with significant financial capital and education not only represents a new competition in the housing market, but goes against the grain of the story that Canadians have told themselves about immigration, he adds. “People imagine that immigrants come here poor and they get to such a wonderful society that they, for the first time in their lives, have real opportunity. People also imagine that Canada is doing something humanely good. What they forget is that there’s a point system, and that poor people and not so-well educated people don’t have an easy time getting into Canada.”

#4: Educational and socioeconomic outcomes vary significantly between second-generation immigrant groups.
When looking at the socioeconomic progress of immigrants over time, those who have been in Vancouver for more than 15 years are doing well in terms of education, income and housing. But the data also show that some groups lag behind in their educational and economic outcomes, even in the second generation. The website’s intersections dashboard allows users to easily interact with different layers of diversity and see such differences instantly.
It reveals, for instance, that Arab, Chinese and South Asian second-generation immigrants are highly likely to have a university degree. But those of Latin American and Black descent are much less so. What’s leading to such differentiated outcomes? Hiebert is wary of drawing conclusions, saying there is no single explanation. But he believes it’s a vital policy issue and one that policy makers and NGOs must examine in more detail. “When I showed this to a CEO of one of the largest immigrant settlement organizations she was just shocked — her jaw dropped,” says Hiebert. “I don’t think people have been able to see quite so easily what the challenges are for certain groups.” Hiebert says this is one of the benefits of this tool — to present us with new information that leads to new questions that lead to potentially new practices and ways of understanding the city’s growing superdiversity.


Explore the Superdiversity website.


